March 04, 2022
Data
Data Analysis by Robert Vagi
Achievement Gaps
In earlier data snapshots, we highlighted the pandemic’s impact on early childhood literacy in Arizona. Our analyses showed a negative impact in all grades, with the worst impacts occurring among the youngest students. (See Part 1: At Benchmark/At Risk and Part 2: Fall-to-Spring Student Progress.)
While these results provide much-needed insight on the pandemic’s impact on students, overall, the question remained: did the pandemic affect all students equally?
National studies show that students living in poverty were disproportionately affected by the pandemic. In this post, we present results that shed light on this issue in Arizona, specifically.
Our Methodology for Analyzing Arizona’s K-3 Data
The analyses presented below look at differences in the percent of students who were “at benchmark” for a subset of schools[1] in the year[2] prior to and in the year following the statewide shift to virtual learning (FY20 and FY21, respectively). Our final sample included roughly 200 elementary schools (i.e. 17% of all schools that report literacy plans).
To determine if students in poverty were affected differently by the pandemic, we compared achievement across three types of schools: high-, medium-, and low-poverty schools.[3] Although this approach allowed us to further disaggregate our analyses, it is important to note that it resulted in smaller samples of schools in each group with ~118 high-poverty schools, ~60 medium-poverty schools, and ~20 low-poverty schools (depending on the grade). Such low numbers of schools in these sub-analyses, particularly low-poverty schools, means that results within each group may not be representative of these types of schools statewide. That said, the results presented below echo the results of other studies. Additionally, it is also important to note that many of these schools (high-, medium-, and low-poverty schools) come from the same districts. Therefore, while these disparities may or may not reflect the state, as a whole, they do provide insight into disparities that are occurring in specific Arizona communities.
When interpreting these results, it is important to remember that they do not reflect the achievement of individual students over time. Rather, they represent schools’ ability to help separate cohorts of students acquire literacy skills.
Finally, while it is true the in many instances “correlation does not equal causation,” this is not the case in this study. Because of its abrupt and far-reaching impact, the pandemic created a natural experiment with cohorts testing prior to school closures serving as “control” groups and those testing after as “treatment” groups. Therefore, we assume that comparisons of student achievement before and after schools went to virtual learning reflect, at least in part, the impact of the pandemic.
What the Data Show
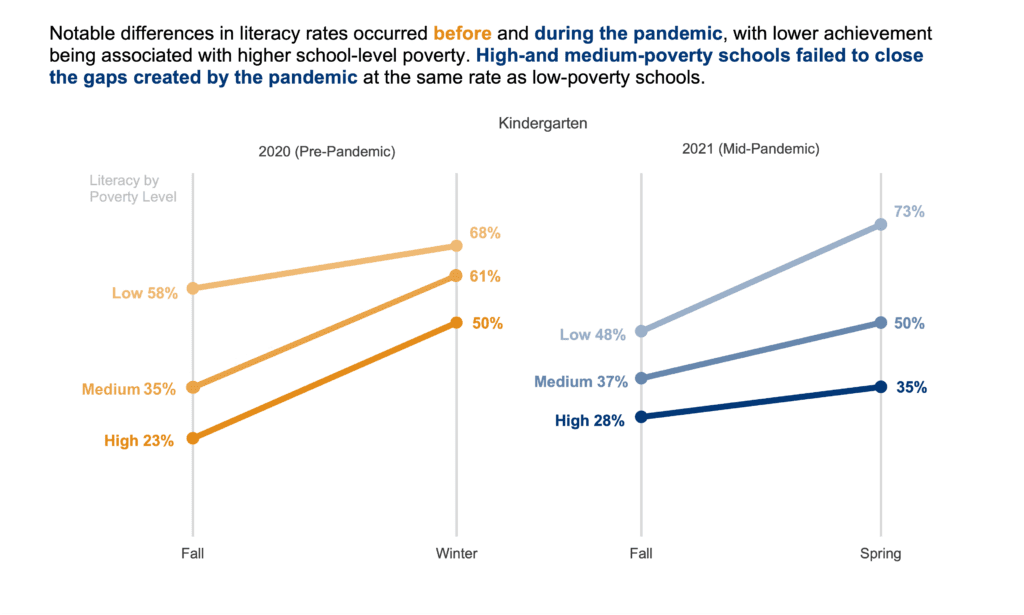
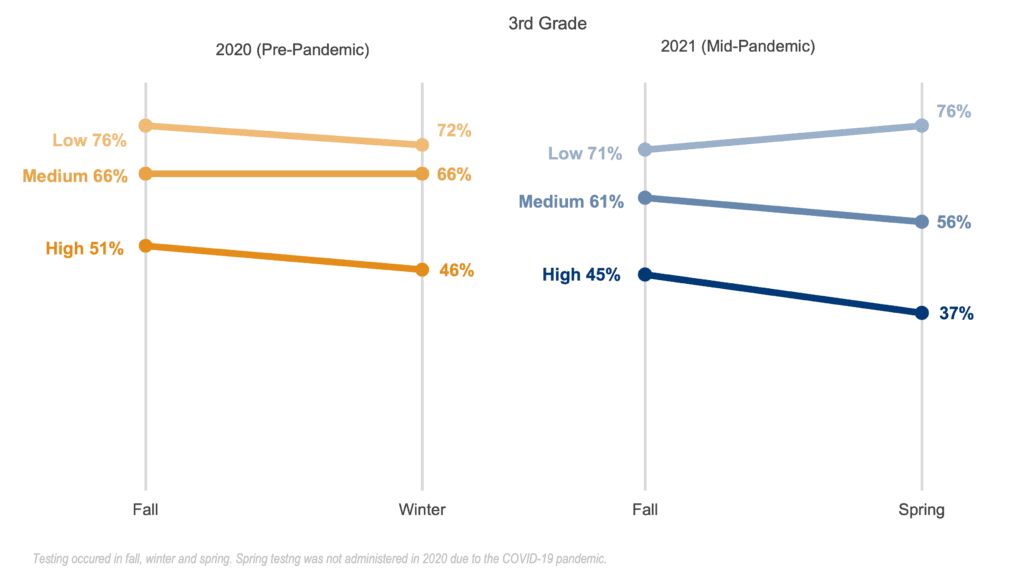
As the figures below show, there were notable differences in literacy rates both before and after the pandemic, with lower achievement being associated with higher school-level poverty.
That being said, it is encouraging to note that at the beginning of the pandemic, literacy rates at high- and medium-poverty schools did not drop at higher rates than at low-poverty schools.
However, when we look at schools’ ability to make up ground, there are marked differences: high- and medium-poverty schools failed to close the gaps created by the pandemic at the same rate as low-poverty schools.
In fact, in the second and third grades, students at these schools fell even further behind while literacy rates at low-poverty schools either maintained or improved.
As a result, achievement gaps widened. For example, in third grade, this amounted to an 11-percentage-point increase in the gap between high- and low-poverty schools at the winter assessment compared to the previous year.


Implications
Although the pandemic appears to have had a similar impact on all schools at its onset, this was not the case as the pandemic progressed. Not only did achievement gaps persist during the pandemic, they grew because of it.
While our data do not allow us to determine the exact causes of this, they highlight the fact that Arizona students living in poverty need additional support.
______________________
[1] To ensure that measurements were comparable across years, we only included schools that used the most common benchmark assessment in the state: Acadience Reading. We did not examine schools using other assessments because many schools change assessments from year-to-year or are in the process of selecting a new assessment. Additionally, given the large number of assessments that schools can choose from, there were not enough schools consistently using a non-Acadience assessment to create a large enough sample for this analysis. Our final sample included roughly 200 schools in each grade. Although this sample represents a fairly small proportion of all schools in Arizona, it includes some of the largest, most diverse school districts in the state.
[2] These analyses exclude the spring assessment of the FY20 school year. This was because schools did not administer a spring assessment in FY20.
[3] Specifically, we defined high-poverty schools as those with greater than 66% FRL enrollment, medium-poverty schools as those with 66%-33% FRL enrollment, and low-poverty schools as those with less than 33% FRL enrollment.