February 02, 2022
Data
Data Analysis by Robert Vagi
Fall to Spring Student Progress
As we described in a recent blog post, there were significant declines in the number of Arizona K-3 students scoring “at benchmark” on formative literacy assessments in the wake of the pandemic, with the worst impact seen among kindergarten and first-grade students.
With this in mind, understanding how the pandemic affected schools’ ability to move students towards grade-level literacy is critically important. To answer this question, Read on Arizona and its partners examined trends in Arizona school literacy data.
Data sharing and analysis is a guiding principle of Read On Arizona, our state’s early literacy collective impact initiative. Comprehensive data and effective data analysis inform strategies and investments, identify gaps and trends, and drive instructional decisions at all levels, from state to student.
Our Methodology for Analyzing Arizona’s K-3 Data
Every year, schools serving students in grades K-3 submit literacy plans to the state. Among other things, these plans include the results of formative literacy assessments given in the fall, winter and spring which indicate how many students are on track to read at grade level by the end of the year.
In the analysis presented here, we look at trends in the percent of students who were “at benchmark” for a subset of schools[1] in the years[2] prior to (FY16-FY20) and in the year following the statewide shift to virtual learning (FY21).
Our final sample included roughly 200 elementary schools (i.e. 17% of all schools that report literacy plans). Although this sample represents a small proportion of all schools, differences between these schools and those not in the sample were small with a few exceptions. Compared to other schools, our sample had:
- A smaller proportion of charter schools (3% vs. 25%)
- A greater proportion located in cities (64% vs. 49%)
- Higher average enrollment (583 vs. 493)
- Higher average rates of students receiving free- and reduced-price lunch (65% vs. 55%)
- Slightly lower academic achievement (42% vs. 48% passing ELA and 40% vs. 47% passing math)
- A greater proportion located in Maricopa County and a lower proportion in Pima County (69% vs. 56% and 5% vs. 16%, respectively)
Despite these differences, our sample includes schools from a wide range of communities. Because of this diversity, the analyses presented here should reflect COVID’s impact on communities throughout Arizona.
What the Data Show
As the figures below illustrate, the percent of students entering FY21 “at benchmark” was significantly lower in nearly all grades compared to previous years. This gap was greatest in first grade, with a 24-percentage-point difference.
Put another way, the percent of students entering first grade who were prepared to read at grade level in FY21 dropped by roughly 40 percent compared to the previous year.
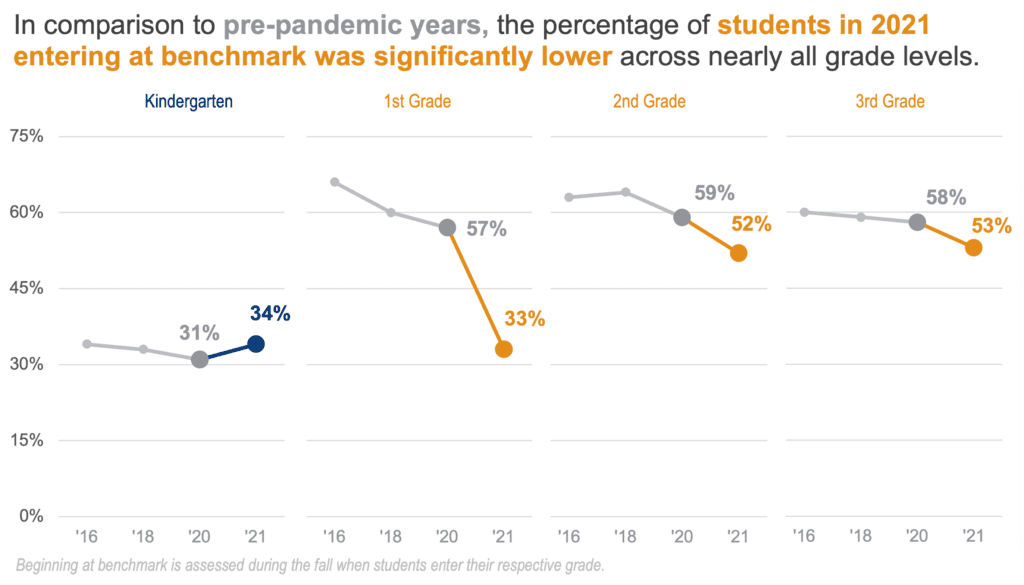
Although we cannot know for certain (see footnote 2), it seems likely that these decreases reflect learning losses from the second half of FY20 (i.e., after the statewide shift to virtual learning).
What’s more, in every grade, these gaps did not close by the spring of FY21. In fact, the percentage of students at benchmark decreased between the fall and spring assessments for second and third grades and rose only modestly in first grade.
These declines suggest that, not only were students not making up losses from the previous year, many were also falling even further behind.

Implications
As our analyses show, students who fell behind during the pandemic will need more than a return to normal. They will need intensive supports well beyond what traditional pre-pandemic schooling experiences offered.
This points to perhaps the most important finding of our analysis: prior to the pandemic (i.e., “normal” years), the number of students at benchmark often declined over the course of a year. In other words, many students were already falling behind academically.
What We’re Doing About It
Every Arizona student deserves equitable access to high-quality reading instruction. Building educator capacity to ensure our teachers have the tools and training they need to support every child’s learning is critical to reaching our collective goals for third-grade reading proficiency.
That’s why partners in Read On Arizona have adopted an Early Literacy Policy Framework for scaling up proven literacy strategies for high-needs schools serving the most struggling readers. These priorities include: strengthening educator capacity and new teacher preparation to dramatically increase the knowledge of educators and practitioners in the science of reading; and intensive literacy coaching to support and sustain effective teaching and literacy practices for our most struggling schools and students.
The collective support of these shared priorities among partners in Read On Arizona informed significant new early literacy legislation (SB1572) and guided recommendations resulting in over $100 million in new investments for early literacy in Arizona.
Arizona’s recent $20 million, five-year Comprehensive Literacy State Development (CLSD) grant also supports high-need populations with wide-scale professional development in the science of reading and the implementation of evidence-based literacy practices.
These investments come at a critical time, as teachers face unprecedented challenges in helping our young students reach their full reading potential. With the right support and instruction, the vast majority of children can learn to read. Regardless of their ethnicity or economic status, we can teach our kids to read, and read well.
______________________
[1] To ensure that measurements were comparable across years, we only included schools that used the most common benchmark assessment in the state: Acadience Reading. We did not examine schools using other assessments because many schools change assessments from year-to-year or are in the process of selecting a new assessment. Additionally, given the large number of assessments that schools can choose from, there were not enough schools consistently using a non-Acadience assessment to create a large enough sample for this analysis. Our final sample included roughly 200 schools in each grade. Although this sample represents a fairly small proportion of all schools in Arizona, it includes some of the largest, most diverse school districts in the state.
[2] These analyses include assessments from the FY16, FY18, FY20, and FY21 school years. Per state law, prior to FY21, districts that were given A or B ratings by the state did not have to submit school literacy plans in odd years. The number of schools that submitted plans in those years are significantly smaller than in even years. Therefore, the sample of schools in those years are not comparable to the years included in our analyses. However, in FY21 districts with any C-rated schools were required to submit literacy plans. This resulted in nearly all districts reporting school literacy plans in FY21. Finally, in FY20, spring assessment data is missing. This is because the spring assessment was not administered in FY20.
______________________